Business management that respects the environment and ecosystems
Strategic guidelines, risks, and mitigation actions
Strategic guidelines, risks, and mitigation actions
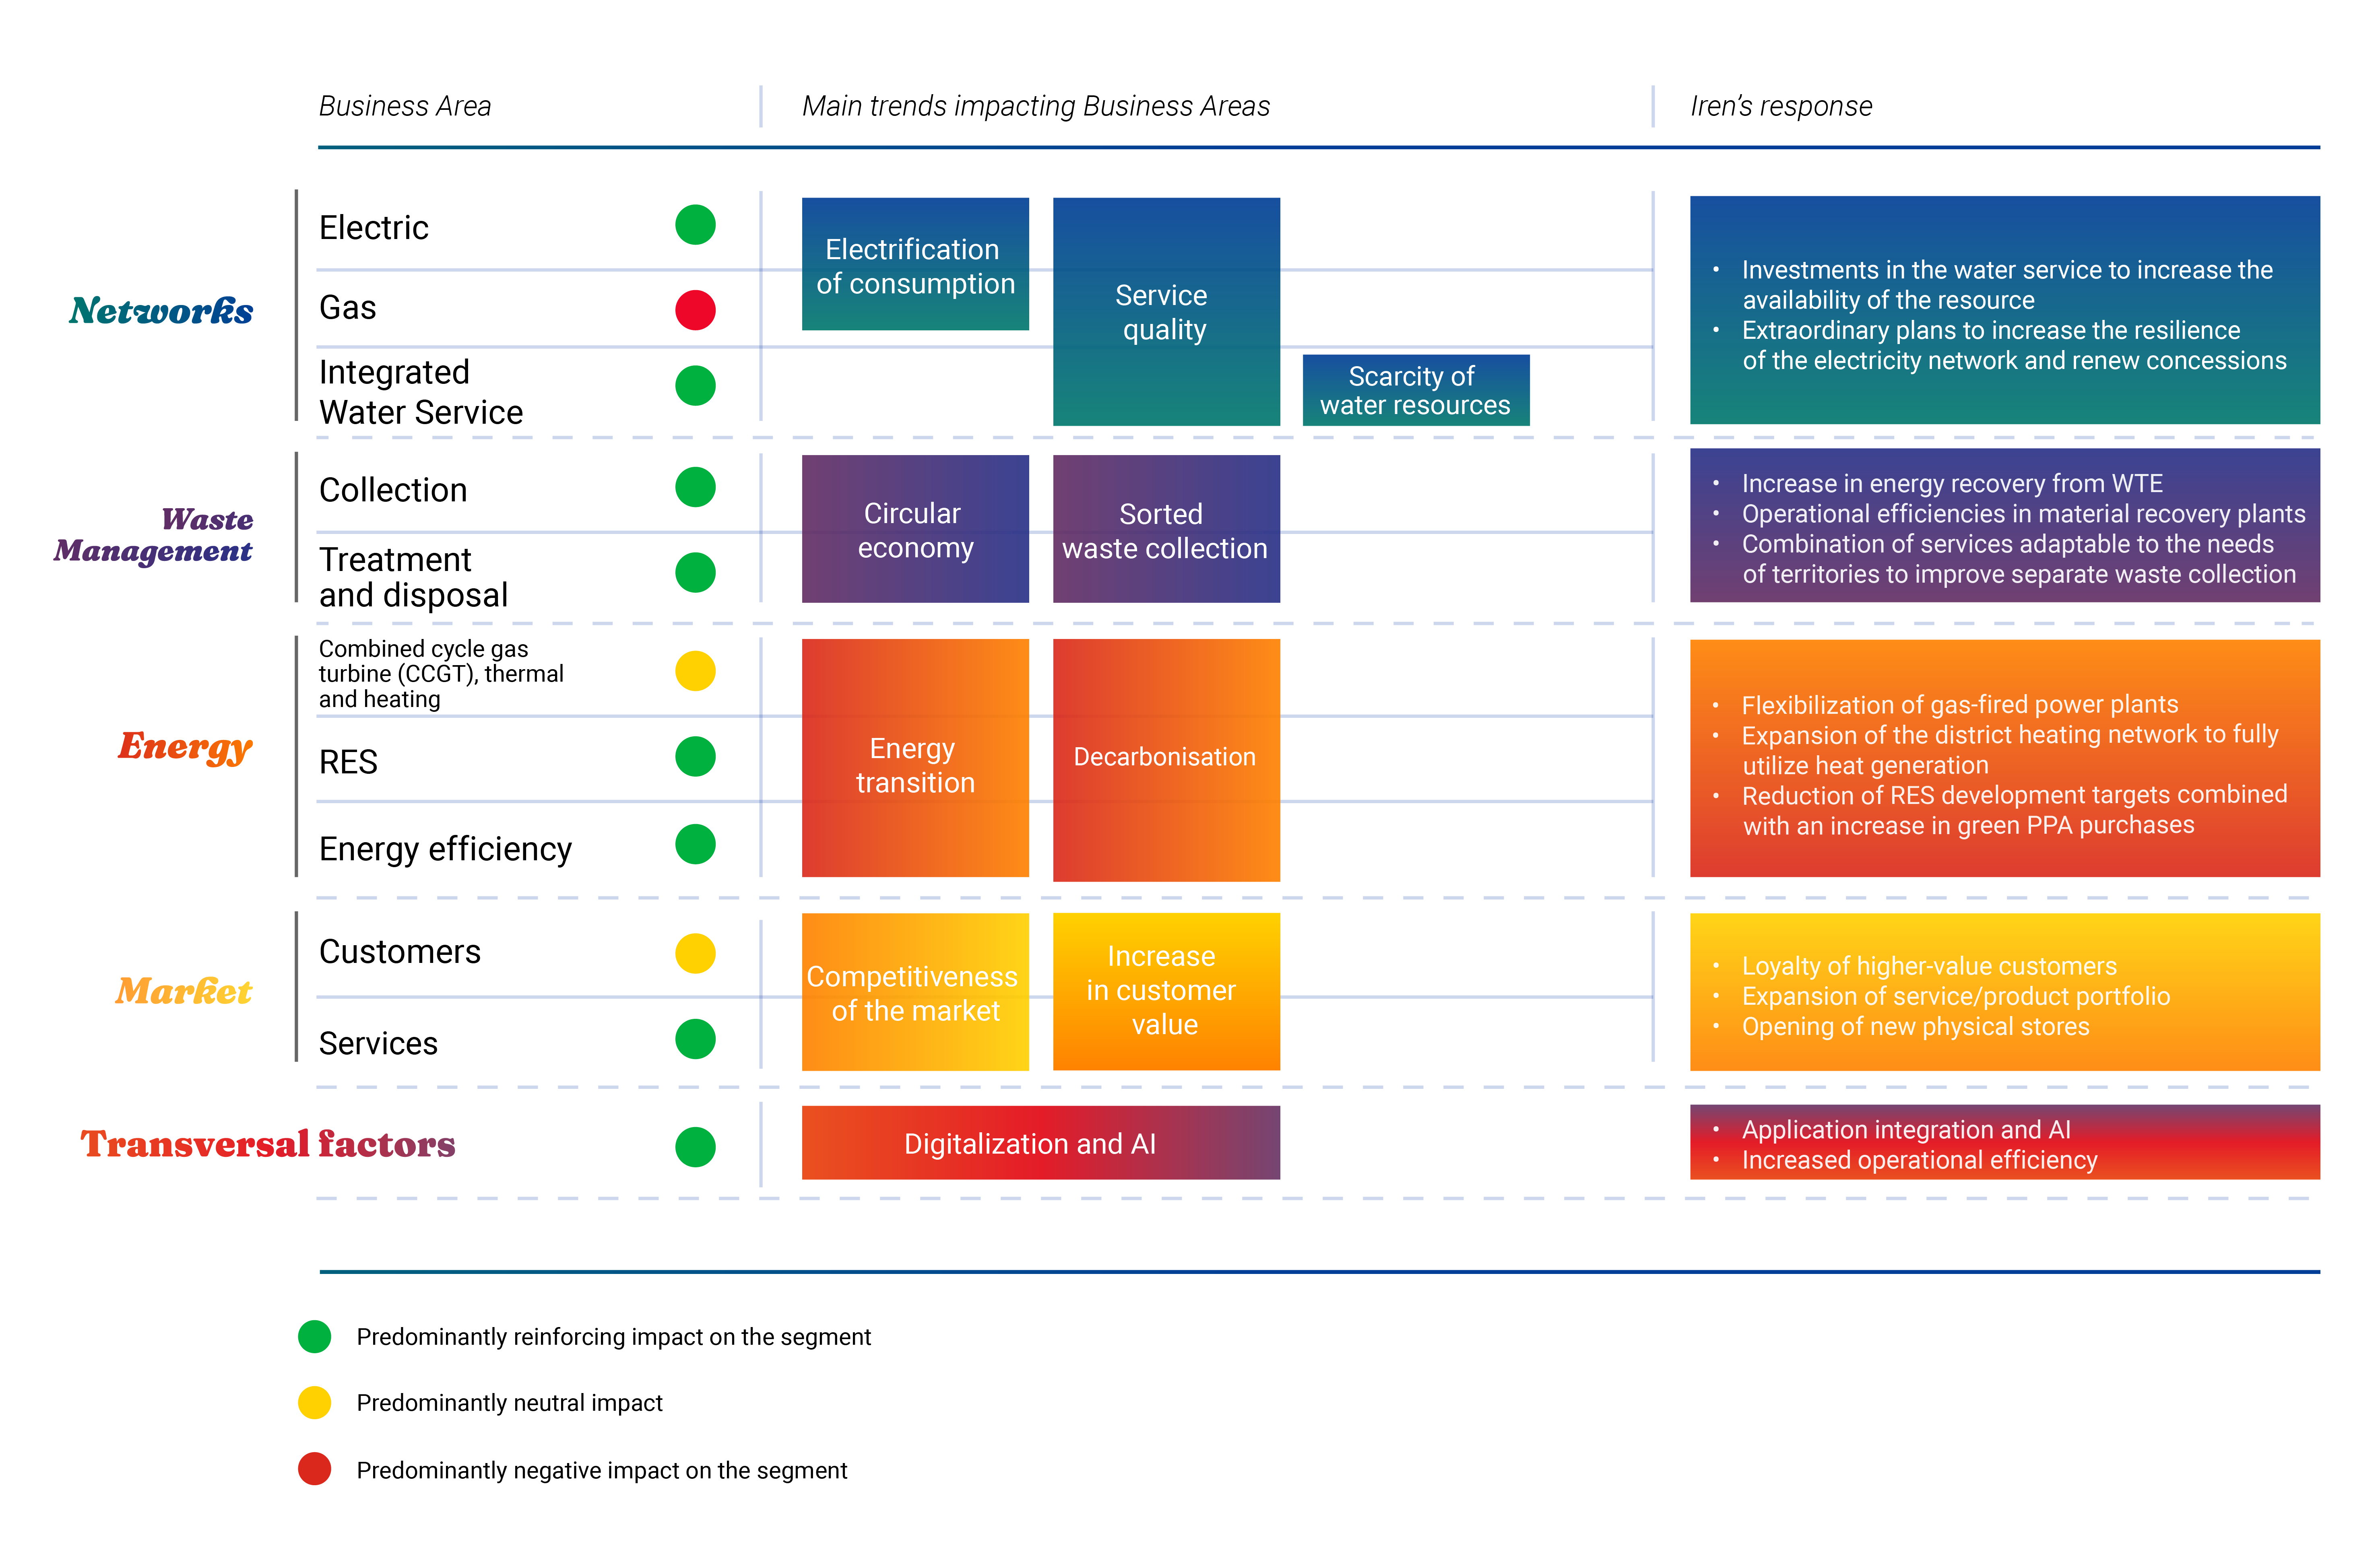
A concrete and visible plan to manage the risks implicit in the various trends.
80%
Regulated
20%
Unregulated
6.4 Bn €
60%
Development
40%
Maintenance
6.4 Bn €
Low execution
risk
risk
High predictability
of results
of results
Main implications on the new Plan
Main implications on the new Plan
The three strategic pillars in addition to translating the ambition of the Iren Group are also the most relevant implications of the new Business Plan.
- Sustainable and conscious use of natural resources
- Recovery of materials and energy from waste
The objective is to optimise cross-selling between enterprises, expand the range of services in different geographical locations, prioritise investments in areas of presence, targeting the needs of local markets. Focus on local consolidation.
- Diversified and resilient business model
Optimisation of quality (actual and perceived) and customer experience across all businesses by leveraging new digital solutions and processes (e.g. call centre insourcing).
- Service quality and customer loyalty as resilience factors
Exposure of business areas to trends
Exposure of business areas to trends
In like with the industry trends identified, strategic and cross-cutting guidelines are provided. The exposures of the main business lines to industry macro-trends are presented below. Networks and Environment are in fact the segments most favourably impacted by the expected trends.
After browsing the table more can be learnt about the risks implicit in the trends and the mitigation actions proposed in the 2024-2030 Business Plan for each Business Unit.
Networks
Waste management
Energy
Market
Cross
Electricity
Gas
Integrated Water System
Cross themes
-
Main strategic risks implicit in trends
- Business and reputational risks in the event of service disruptions or interruptions
- Reputational and business risks related to technological and digital inadequacies of networks
Derisking Target @2030
-18%
System Average Interruption Duration Index (SAIDI) vs 2024
Main mitigation actions
- Network resilience measures with network upgrades, aimed at improving the performance, safety and technical quality of assets and commercial operations
- Upgrading to future networks by accelerating investments to support performance improvements, electrification of consumption (distributed generation, electric vehicles) and digitalisation (2G smart meters, remote control)
- New primary substations
- Network resilience measures through the PNRR (National Recovery and Resilience Plan)
+60%
Regulatory Asset Base (RAB) growth vs 2024
-
Strategic risks implicit in trends
- Stranded assets due to reduced consumption as a result of electrification
- Reputational and business risks linked to the technological and digital inadequacy of networks
Main mitigation actions
- Maintenance of the current network in the reference territories and energy transition/digitalisation
- Replacement of the network to increase its safety
Derisking Target @2030
+15%
Regulatory Asset Base (RAB) growth vs 2024
-

Main strategic risks implicit in trends
- ESG and business risks related to security issues in terms of network losses
- Risks related to operational efficiency and service quality
- Possible environmental impacts resulting from management and infrastructure activities
Derisking target @2030
27%
Water losses (traditional territory @2030)
240
Water withdrawals from the environment (liters/inhabitant/day - all areas)
Main mitigation actions
- Maintenance and adaptation measures to reduce environmental risks associated with water collection (e.g. dam maintenance) to improve operational efficiency and service quality
- Measures aimed at upgrading the network (i.e. reducing leaks, improving purified water quality, increasing the rate of purification)
- New purification plants
- Measures to improve network resilience through the PNRR (National Recovery and Resilience Plan)
4,438
Treatment capacity (K equivalent inhabitants)
79%
District subdivision of aqueduct networks (traditional territory)
+52%
Regulatory Asset Base (RAB) growth % vs 2024
-
Main strategic risks implicit in trends
- Delays in authorising the construction of new plants or modifications to existing plants
- Impact of climate change and hydrogeological instability on assets
Main mitigation actions
- Increased investment in network resilience and maintenance
- Structural interventions
- Emergency service 24/24
- Redundant networks
- Development of innovative technical/economic solutions
- Preparation of development pipeline
- Consolidation in the target areas of the integrated water service and gas distribution
Collection
Treatment and Disposal
Cross Themes
-

Main strategic risks implicit in trends
- Risk of negative changes in service levels in the context of collection activities
- Risk of operational inefficiencies and indirect impacts related to the management of collection activities
Derisking Target @2030
4.2 mln
Residents served @2030
Main mitigation actions
- Investments in dedicated development activities such as equipment, vehicles, etc.
- Precise planning of collection activities
- Implementation of all business continuity strategies (BCM)
>75%
Sorted waste collection @2030
-
Main strategic risks implicit in trends
- Risk of inefficiency and slowdown in business linked to landfill and plant saturation
- Delays and cost overruns in plant design (e.g. CO2 capture plants) due to potential inefficiencies in the supply chain
- Implementation risk for plants with innovative technologies
- Reduced availability of outlet markets for recovered materials (e.g. plastics)
Derisking Target @2030
+8%
Emissions avoided from waste recovery (ktCO2 vs 2024)
+63%
Recovery of material (kton vs 2024)
Main mitigation actions
- Optimisation of waste chain flows
- Design of landfill expansions or new constructions
- Expansion of energy recovery capacity
- Reduction of technical and industrial risk, with maintenance work on existing plants
- Planning and continuous monitoring with a dedicated cross-business task force for project authorisation and dialogue with authorities
+21%
Waste treated (kton vs 2024)
+310%
Biomethane produced (Mm3 vs 2024)
-
Strategic risks implicit in trends
- Change in prices of recycled materials
- Impact competitive dynamics on optimising sources and uses in the plastics supply chain
Mitigation actions
- Differentiation of waste streams and plans for the construction of facilities along the various supply chains
- Renegotiation of contracts with local councils
- Increase in collection base and treatment capacity
- Consolidation of waste collection services in the relevant areas
RES
CCGT, Thermal and Heating
Energy Efficiency
Cross themes
-

Main strategic risks implicit in trends
- Fiscal and financial risk due to volatility in energy scenarios and variability in incentives
- Energy commodity price risk
Main mitigation actions
- Management and periodic monitoring of energy supply chain risks (Risk Policy with related Risk Committee, management with hedging, definition of risk metrics, etc.)
- Active position management strategy to stabilise margins by aligning commodity indices for purchases and sales
Derisking Target @2030
1,070
RES capacity MW VS 837 @2024
-
Main strategic risks implicit in trends
- Energy commodity price risk
- Business and reputational risks in the event of service disruptions or interruptions
- Risks associated with the decarbonisation of the heating sector
Derisking Target @2030
+22%
district heating volumes (Mln m3 vs 2024)
Main mitigation actions
- Evolution/development of the TLR network through the adoption of innovation (e.g. smart grids) and levers for decarbonisation (e.g. waste heat, etc.)
- Extension of the TLR network
- Drive towards decarbonisation/circularity of the system
- Energy optimisation in the operation of the TLR network
- Adoption/piloting of innovative technologies
- Completion of plant flexibility, including air cooling
- Management and periodic monitoring of energy supply chain risks (Risk Policy with related Risk Commission, management with hedging, definition of risk metrics, etc.)
-44%
carbon intensity (gCO2/KWh) vs 2024
-
Main strategic risks implicit in trends
- Changes in the legislative/regulatory framework with negative effects on business (e.g. reduction in incentives)
Main mitigation actions
- Monitoring regulatory developments regarding incentives for energy efficiency measures and business reorientation
- Enhancement of districts starting with the redevelopment of key services (e.g. schools, hospitals, public buildings)
- Smart services (security, restricted traffic zone access, parking, etc.)
Derisking Target @2030
200
Building redevelopment projects 2025-2030
-
Strategic risks implicit in trends
- Risks in the authorisation and implementation of new plants or modifications to existing plants
- High level of competition on hydroelectric, electric and thermal plant concessions
Mitigation actions
- Planning, monitoring and dialogue with authorising agencies with a dedicated cross-business task force for project authorisation
- Monitoring of expiring concessions, proactive dialogue with entities and achievement of set targets, and preparing extensive development pipeline
- Preparation of extensive development pipeline
- Consolidation of the district heating and public lighting service in the target areas
Customers
Services
-

Main strategic risks implicit in trends
- Strategic and business risk of increased churn rate due to aggressive actions by competitors, extraordinary repricing and exceeding of maximum protection
- Risk of ineffective commercial campaigns
- Risk of energy commodity prices
Derisking Target @2030
+21%
Electricity sold to retail customers vs 2024
Main mitigation actions
- Investment in EE and gas marketing campaigns to maintain and grow the customer base, with a strong mitigating impact on strategic and business risk
- Focus on improving service quality and personalisation; anti-churn policies and loyalty programmes
- Acceleration of the rebalancing of acquisition channels in favour of pull channels, digital channels and physical stores
- Energy supply chain risk management (dedicated Risk Policy with related Risk Committee, management through hedging, definition of risk metrics, etc.)
+240
Insurance and connectivity contracts vs 2024
-
Main strategic risks implicit in trends
- Business risk due to pressure on margins and churn rates given competition from ‘any-to-any’ ecosystems (service platforms with integrated customer experience)
- High competition on new products and developments
Main mitigation actions
- Investments enabling cross-selling of IrenPlus services with a strong mitigating effect on strategic and business risk (home solutions with high customer loyalty)
- Development of bundled offers (including connectivity)
Derisking Target @2030
120
Stand-alone insurance and services contracts (k vs 50 2024)
People
IT
-
Strategic risks implicit in trends
- Perdita di competenze chiave con ripercussioni sul raggiungimento degli obiettivi
- Difficoltà nel reperimento di profili professionali specialistici in linea con le esigenze evolutive di business e/o profili tradizionali
Mitigation actions
- Mapping of critical skills, retention and corporate welfare initiatives, compensation & benefit policies, back-up figures
- Multi-channel personnel selection (e.g., IrenFutura, LinkedIn, specialised websites, social media pages); change management/training programmes
- Leadership and managerial skills development programmes
-
Strategic risks implicit in trends
- IT/OT compliance risk due to the proliferation of regulations (NIS2, AI Act, etc.) requiring identification and management
- Lack of IT/OT system resilience due to causes attributable to suppliers, cyber attacks or natural events, amplified by new attack surfaces and vulnerabilities
Mitigation actions
- IT/OT infrastructure upgrade
- NIS2 roadmap implementation
- IT platform rationalisation
- Skills enhancement
- Training/procedures; access control, backup and restore
- Business Continuity Management (BCM) model